


The graph included in this article was particularly useful back in 1981 to illustrate that prices were truly rising at a pretty fast rate. It is interesting now to compare prices of 1981 to our current prices for these 3 stocks. Prices are for excellent condition examples.
Wells Fargo (1866) 1978 $100, 1981 $650, and today $1200
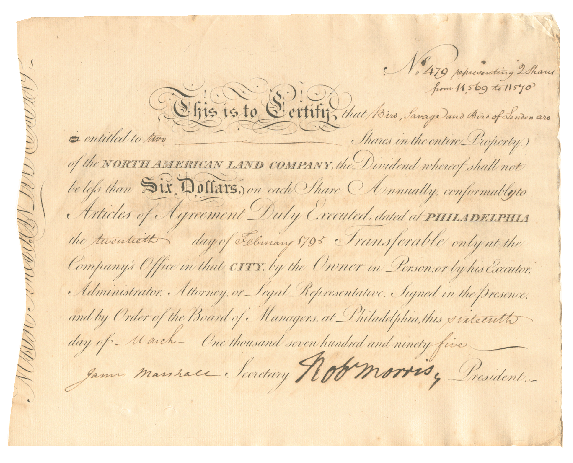
North American Land Co. (1797) 1978 $200, 1981 $550 and today $1200
Philadelphia & Lancaster Turnpike Co (1795) 1978 $250, 1981 $500 and today $1000
This article was published in the Spring of 1981 in issue Two of The Labarre Newsletter.
The Investment Outlook
Even a novice collector, investor, dealer, or speculator in collectible stocks and bonds knows full well the spectacular increases that have been registered for many stocks and bonds over the past two years. Increases such as these are revealing barometers of past performances, and provide insight into future prospects for appreciation as well.
Often, a single stock or bond is utilized to illustrate a particularly noteworthy rise in market value. However, these increases are seldom if ever plotted over an extended time period, but rather reflect only an increase between two time frames. By tracing several stocks over a longer time continuum, the upward movement of market prices can be more fully appreciated.
This graph charts three different, high quality stocks and their respective price performances. Prices used were culled from a variety of sources like auction catalogs and corresponding lists of prices realized, dealers' catalogs, classified advertisements, and magazine and newspaper articles published over the past two years. Prices indicated on the graph were almost always cross-checked in at least one other source to verify their accuracy at a particular point in time. Increases in the field as a whole correspond generally to the increases reflected in these representative stocks.
One need not be a financial analyst or statistics expert to interpret this graph. As these examples point up so clearly, prices of collectible stocks and bonds have experienced a succession of sharply upward movements. Despite some flatness in the market lately market values continue to climb. Contributing factors of scarcity, demand, and new participants in the field give rise to equally optimistic projections for future months.
This last point merits further attention and elaboration with the discussion of a hypothetical situation. Suppose, for example, that six new dealers and six new major collectors found their way into the stock and bond field in the coming year. Certainly this is a very real possibility given the newness and expanding nature of the field. Injecting this level of "new blood" would no doubt propel the market into another growth spurt along the lines of the one experienced over the course of the past two years. While this could happen on its own as outside individuals become aware of the field and become active in it, the chance of this happening is greatly increased if dealers, collectors, and investors alike make individual and collective efforts to make the field known. Unquestionably, the positive results of this taking place would benefit the entire field of collectible stocks and bonds.


Originally Published and Printed by G.Labarre, The LaBarre Newsletter, Issue 2, Spring 1981


![]()


Ebay ID: labarre_galleries